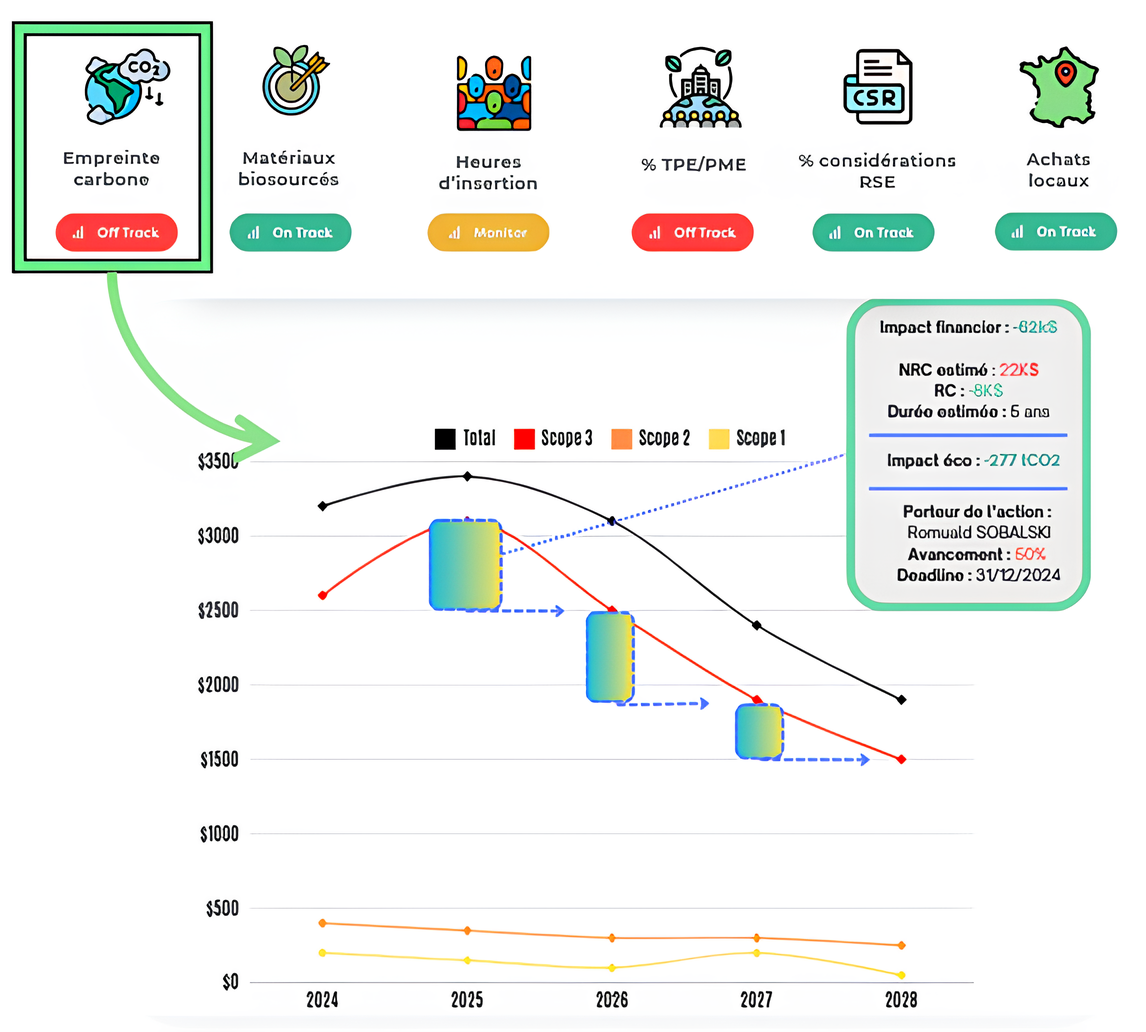
Scope 3 reduction

90% of CSR issues are located in the supply-chain.
Take back control on impact, costs, risks and image.

What is Scope 3 ?

Scope 3 cover all indirect emissions. They include:

Purchase of good and services
Upstream and downstream transportation
Use and end of life products
Investments and others matters

But data collection relies too heavily on “spend-based ratios”.
Usual estimates can be up to 30 % off from real-world figures.

Challenges and issues for 2025-2027

Since the 1980s, manufacturing has been off-shored.
Scope 3 emissions are getting harder to reduce due to:

Data quality and availability
Accuracy of information used for decision making
Suppliers support
Effort needed to enable Scope 3 reductions
Data availability

Buyers are requesting pre-processed  data with no clear rule of what is expected.

Data quality

Current state of the art is "spend-based ratio" which has little to do with manufacturing and could be 30% off.

Suppliers support

Your suppliers do not have the same level of maturity. Some will simply ignore you requests over production.

Reporting hell

Collecting data, cleanse it then transform it in into actionable insight is hard work.
Mostly done manually.

Engaging suppliers

Obtaining reliable data requires collaborating with each supplier, regardless of their maturity level.
Without genuine commitment, data collection stalls and action plans struggle to get off the ground.

Shiffting from collection to reduction

Too much time is spent on reporting at the expense of actually implementing reduction measures.
It is now necessary to streamline data collection in order to focus on supplier action plans.

Our approach at  

  1. 1. Identify
  • Connect to your ERP and others data sources to map your supply-chain.
  • Set up a digital twin of your supply chain to select suitable emission factors and structure your Scope 3.
  • 2. Plan
  • Prioritize high-impact categories and suppliers.
  • Develop a collaborative roadmap with your procurement teams and stakeholders.
  • 3. Implement
  • Provide a secure collaborative portal to collect primary data from each supplier.
  • 4. Report
  • At the level of your company, each supplier, or each purchased SKU.
  • Generate custom dashboards: model reduction trajectories,quantify detailed action plans, track collection progress, and run comparative analyses across periods.
  • 5. Reduce
  • Identify alternatives aligned with your organization’s objectives(cost, contribution to reduction targets).
  • Manage the implementation of technical alternatives (material substitution, logistics optimization, supplier changes) by collaborating with your suppliers and organization members (tasks,projects, and approval workflows).

Why  

  1. Accurate Measurement
  • Move from approximate spend-based ratios to accurate and auditable data.
  • Green-Graph guarantees a reliable measurement based on physical data available at each step of the value chain.
  • Time Savings
  • Green-Graph automates the retrieval of critical data.
  • Dynamically measure reductions based on business decisions.
  • Impact Reduction with Competitiveness
  • Separating impact from economic performance jeopardizes the sustainability of your reduction initiatives.Provide a secure collaborative portal to collect primary data from each supplier.
  • Green-Graph allows you to manage your impacts at the same level as other KPIs (cost, OTD, OQD), ensuring continuity even in times of crisis.
  • Transparency and Auditability
  • Green-Graph offers transparency in calculation methods, selection of emission factors, and stores historical user data.
  • Secured and end to end encrypted supplier portal.
  • CSR risks and compliance management
  • In-depth Scope 3 analysis is an opportunity to reduce your risks.
  • Green-Graph increases your visibility across the value chain (all tiers of suppliers, their capacities, their certifications).
  • Life Cycle Analysis
  • Collaborate with your suppliers to perform life cycle analyses of your products, enhancing measurement accuracy by increasing supply-chain visibility.
  • Green-Graph increases your visibility across the value chain (all tiers of suppliers, their capacities, their certifications).
Want to learn more ?
Let's explore how we can accelerate the mapping and reduction of your scope 3.
Get Started